A more scalable approach to calling VirusTotal is to arrange the output of the Request as a Pandas Dataframe. The results of the calls could potentially be stored locally on a NoSQL instance such as ArangoDB or Mongo DB (search previous articles for a short exploration of ArangoDB).
import requests
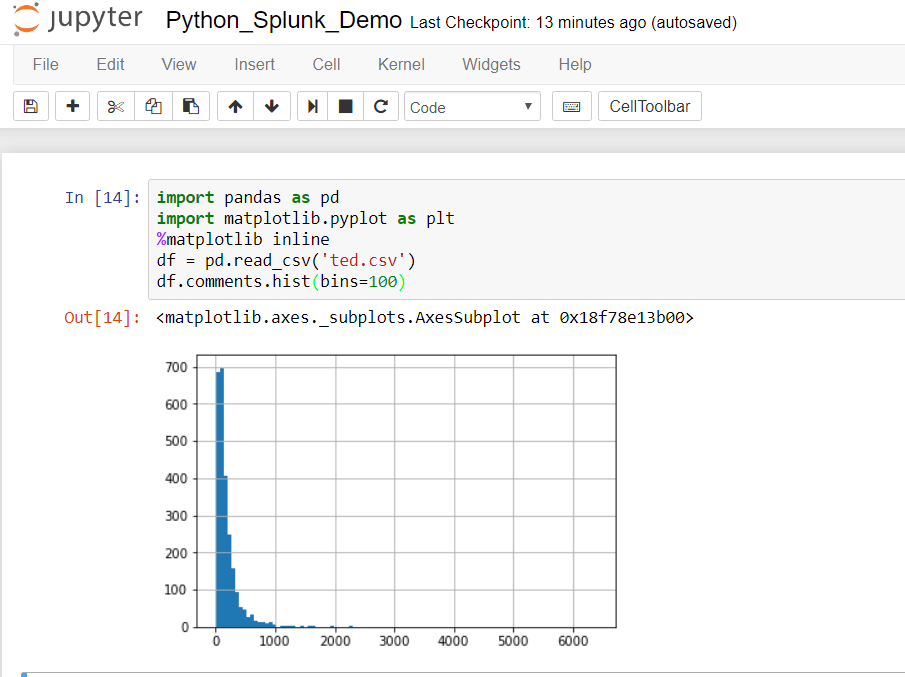
import pandas as pd
class HashChecker():
'''
The HashChecker object is used to process, arrange and store VirusTotal API calls
against a file hash - the results are neatly arranged in a Pandas DataFrame
hash : str
This argument is used to pass the single hash in question
Todo:
create the ability to pass multiple hashes
'''
def __init__(self, hash):
self.hash = hash
self.myparams= {}
# HTTP Request results
self.request_results = []
# VirusTotal settings
self.filename = 'c:\\projects\\python\splunk_py\\.virustotalrc'
self.url = 'https://www.virustotal.com/vtapi/v2/file/report'
# process the hash
self.get_params()
# Get the results of hash check from Request call
self.request_results = self.get_results()
# use a dataframe for flexibility and scalability
self.df = pd.DataFrame()
self.set_results_dataframe()
def get_results(self):
'''
Method to call the REST API and check a single hash
'''
data = requests.get(self.url, params=self.myparams)
return data
def get_params(self):
'''
Method to get your hidden key from an ini file
read the values from a file with format
apikey=<yourapikey>
'''
with open(self.filename) as myfile:
for line in myfile:
key, value = line.partition("=")[::2]
self.myparams[key.strip()] = value.strip()
def set_results_dataframe(self):
'''
Method to create a dataframe with results using format
columns
rows
service1 detected result update version
service2 detected result update version
'''
# use a dataframe that gets the normalized json from Request result
# notice we only want the 'scans' level of the json
self.df = json_normalize(self.request_results.json().get('scans'))
# to aid in re-arranging more logically, tranpose rows and columns
self.df = self.df.transpose()
# create a holding dataframe in order to re-arrange the
# columns more logically
ndf = pd.DataFrame(columns=['detected', 'result', 'update', 'version', ])
for i in range(0,len(self.df),4):
ndf=ndf.append({ 'detected' : self.df.index[i].split('.')[0],
'result': self.df.iloc[i+1,0], 'update': self.df.iloc[i+2,0],
'version' : self.df.iloc[i+3,0]}, ignore_index=True)
# reset the object dataframe to this new arrangment
self.df = ndf
Using the above code leaves you with a hash result object, which you can easily interrogate and manipulate in a Jupyter Notebook:
# hash of mimikatz
resource = 'BCD703932C9BEDE27659407E458AE103D0B4CC88'
hash_results = HashChecker(resource)
print(hash_results.request_results)
print(hash_results.df.head(4))
Here is the response code from the Request
<Response [200]>

The first four rows.
  detected                result    update      version
0    ALYac                  None  20190719      1.1.1.5
1     APEX             Malicious  20190719         5.53
2      AVG  FileRepMalware [PUP]  20190720  18.4.3895.0
3  Acronis                  None  20190716     1.0.1.51
Notice that the data exchange format with VirusTotal is JSON. We did some crude ‘slash and burn’ processing to contort the nested JSON into a dataframe. This can be improved upon, and we will improve on it with a more extensive article on understanding JSON and introducing the json parsing module in Python.
For now, notice that JSON looks a lot like a Python Dictionary, but strictly speaking isn’t the same. Here’s an Important semantic distinction that will be helpful to keep in mind: A python dictionary is a data structure within Python, whereas JSON is a human and machine readable string format for exchanging information across platforms and languages.
In the first four rows it’s apparent that two services don’t detect mimikatz, and two do. AVG does a nice job of portraying exactly what is the case with mimikatz: a PUP – Potentially Unwanted Program. If this hash is on your Enterprise and your security team didn’t place it there, that’s likely an issue. In itself, though, it’s simply a security tool.
What has been created in these four articles on Splunk and API programming is a primitive start to an in-house Threat Intelligence service to test every process spawned. This can also be the start of an approach to whitelisting and/or baselining. By amassing a list of hashes and hash testing results locally, a security team can alert on any new process spawned on the Enterprise and/or not in a baseline.
It should be pointed out that the above is not in itself a sound strategy to combat mimikatz–anyone who has hired a pen-test team will know that a hash check isn’t going to stop a mimikatz attack. Smart hackers will either obfuscate the binary or use powershell to evade AV. You will only catch the most lame attempts with a hash check. The best approach is to stop storing passwords clear text in memory.
That said, it’s always possible that Virustotal, with its dozens of services, will turn up something interesting on a hash that local AV is missing. Passive whitelisting (alerting to new hashes on the Enterprise) together with tight Powershell auditing will provide a much more solid foundation. To state the obvious: things that have never been seen before are interesting, as far as scripts or executables.