Jupyter
Before delving back into the resulting data from article #1, let’s digress a bit to discuss another great tool for any Python-minded security person–especially for anyone interested in data analysis. Skip this entire section if you are already a Jupyter user. The Jupyter Project is an open-source effort responsible for developing the Jupyter Notebook: a free tool used for code-sharing and visualization sharing that also happens to be a boon to interactive exploration of data and code.
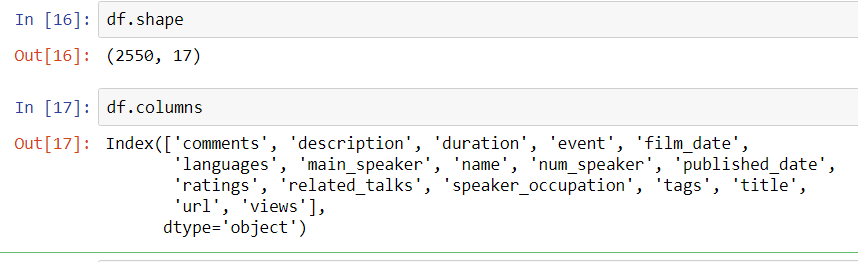
Jupyter supports Python, R and Scala: the languages of choice for people working on Big Data. It’s especially nice for interactive visualization: it takes the place of Ipython for quick and dirty interactive computing. For people who are already set in a good IDE such as Spyder, it might not be as attractive. However, if like me you tend to use VI then Jupyter is a natural tool for interactivity and visualization. Let’s load the Ted Talks dataset from Kaggle into Jupyter as a preliminary exercise.
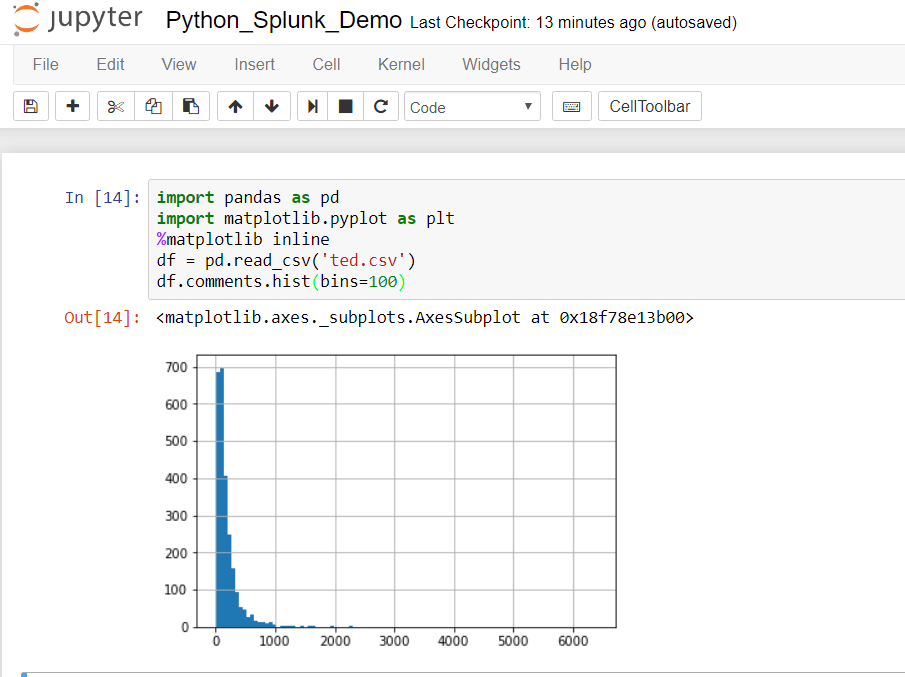
The ability to interactively create a shareable, presentation -ready graphical plot with this brief snippet of coding gives you some insight into the popularity of Jupyter.
Using Pandas
Pandas is a Python module that provides a tabular data structure called a dataframe. The use of dataframes allows for efficient manipulation of large data sets in a familiar spreadsheet-like row- column orientation. There is a fair amount of nuance and peculiar syntax involved in acquiring mastery of pandas and dataframes, not to mention closely related topics such as visualization and statistical analysis However, simple skills such as dataframe creation, data export and data access are quickly acquired.
If you want a quality in-depth pandas review, Kevin Markham has some fantastic free courses on pandas available on YouTube through his DataSchool. Check out a beginning session and you will be navigating pandas in no time. Also, Wes McKinney–the main author of pandas–has an excellent O’Reilly book on the subject: Python for Data Analysis.
Sysmon Data
Turning back to where we left off with getting Sysmon data from Splunk, we had a resultsReader object from the Splunk SDK and printed out the raw data. We had simply printed out raw results, but instead let’s now create a Pandas dataframe from it. Putting all of the code into Jupyter including the class files we can modify the driver to below.
def main():
    # create a connection to Splunk
    sc = SplunkConnection()
    # run a search
    ss = SplunkSearch(sc.service)
    # define the search in SPL
    query = 'search source="WinEventLog:Microsoft-Windows-Sysmon/Operational"'
    # limit to 10 results (just for demo speed) and set the search
    ss.set_blocking_search(query,10)
    # set to a dataframe
    d = []
    for result in ss.get_search_results():
        d.append(result)
    df = pd.DataFrame(d)
Now we have a dataframe that we can explore interactively.
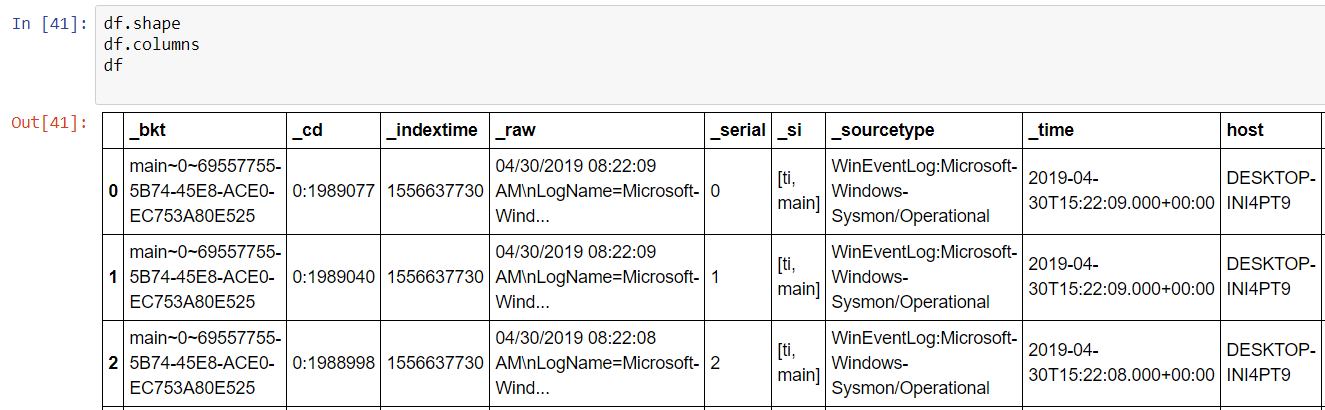
A few things become immediately obvious: Splunk Web doesn’t require an explicit ‘search’ command word nor does it display most internal fields, i.e. fields that begin with ‘_’ . It will be necessary to inhibit these by adding a command | fields – _* to the search. It will also be necessary to specify fields that you want to capture to bypass any optimization or ‘fast mode’ behavior that is happening behind the scenes when searching with the SDK. Let’s craft a better search command to simply capture hashes.
search index=sysmon source="WinEventLog:Microsoft-Windows-Sysmon/Operational" | fields Hashes | fields - _* | head 10
This results in:
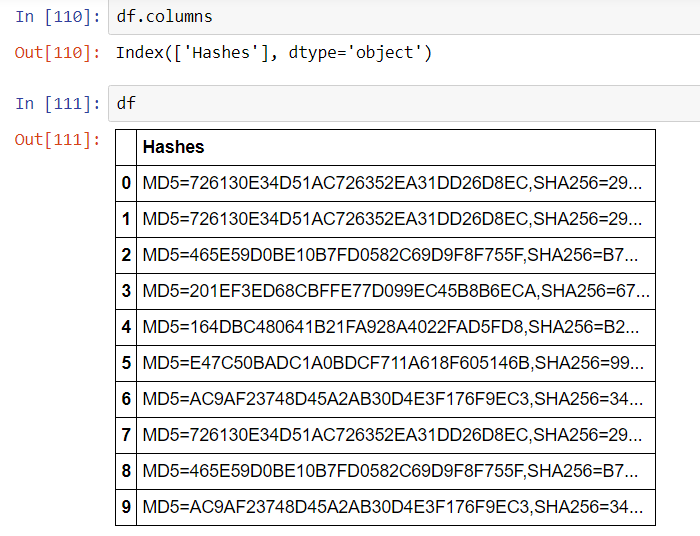
Jupyter has provided an extra layer of readability to the dataframes making them easy to work with and view. Beyond that, we have a simple way to experiment with searches and interactively craft new ever more useful searches with customized fields and filters for any requirement. The next logical step is to build in some automation while combining the dataframe with threat intelligence information.
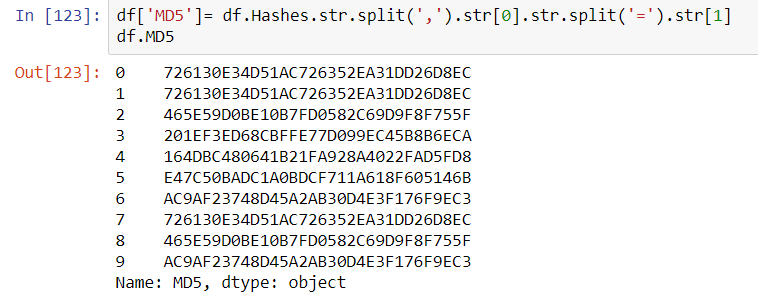
If the objective is to send bulk hashes into a service such as VirusTotal, then it would be nice to separate them out into their own columns: a SHA256 column and an MD5 column. With pandas, this is simple.
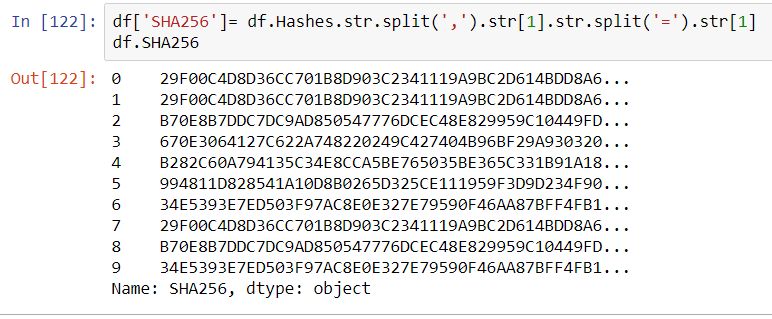
In this example creating a new column to the dataframe df simply consisted of declaring it with df[‘SHA256’] and populating it with a series of splits inside the Hashes columns to obtain the appropriate substring. The same can be done for the MD5 hash.
The Sysmon config filter file can be applied and reapplied to get any or all hash formats: sysmon -c -h * will provide all hashes including the IMPHASH, which might be useful to find processes that hackers have tried to obfuscate by simple means to avoid AV detection. In the next article we will work with automating submission to VirusTotal using the VirusTotal API.